Read the results
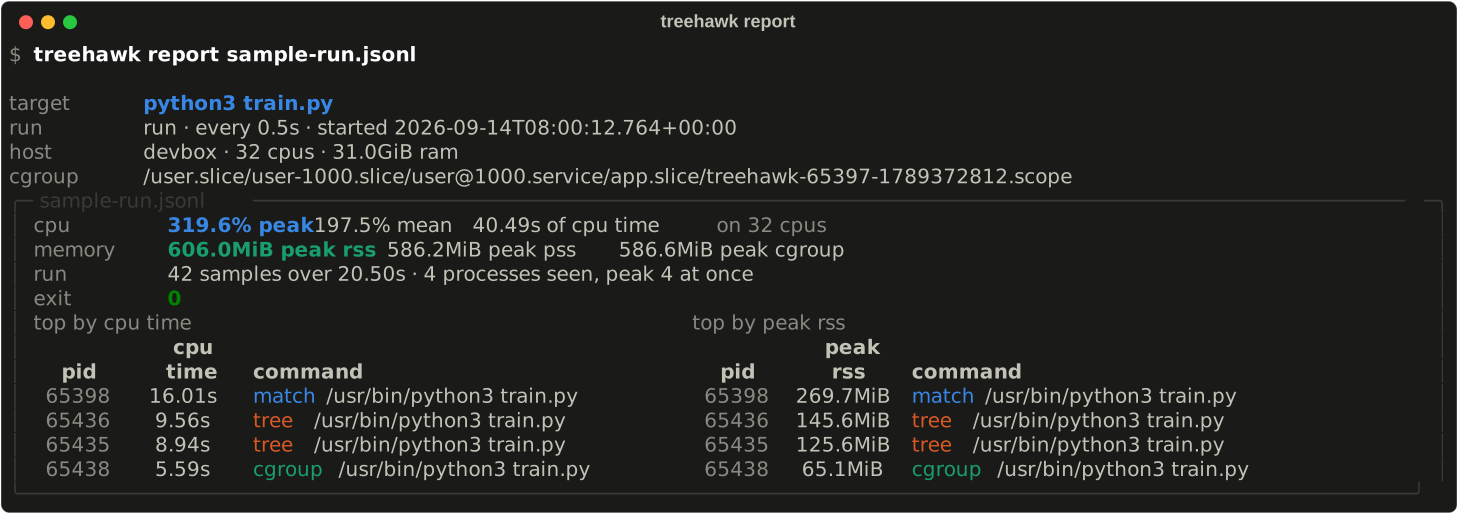
Every run leaves a log of CPU and memory usage over time. report summarises it
in the terminal, and pdf turns it into a report with charts. Both work on either kind of log (a watch/run log or a
top directory) and tell them apart by the log's header. They also work on the
log of an interrupted run, because the summary is recomputed from the samples
that were written.
treehawk report run.jsonl            # summary in the terminal
treehawk report run.jsonl --json     # header and summary as JSON
treehawk pdf run.jsonl               # writes run.pdf
treehawk report treehawk-top --since 2h
report
| Option | |
|---|---|
PATH |
a log file, or for top a log directory, boot directory or single file |
--json |
print the summary as JSON instead of tables |
--since TIME |
top logs only: start here |
--until TIME |
top logs only: stop here |
TIME is either a moment ("2026-09-27 14:00", ISO 8601, local time unless a
zone is given) or a span ago (90, 30m, 2h, 1d).
pdf
| Option | Default | |
|---|---|---|
PATH |
as for report |
|
-o, --output PATH |
beside the log, as .pdf |
where to write the PDF |
--since TIME, --until TIME |
top logs only, as for report |
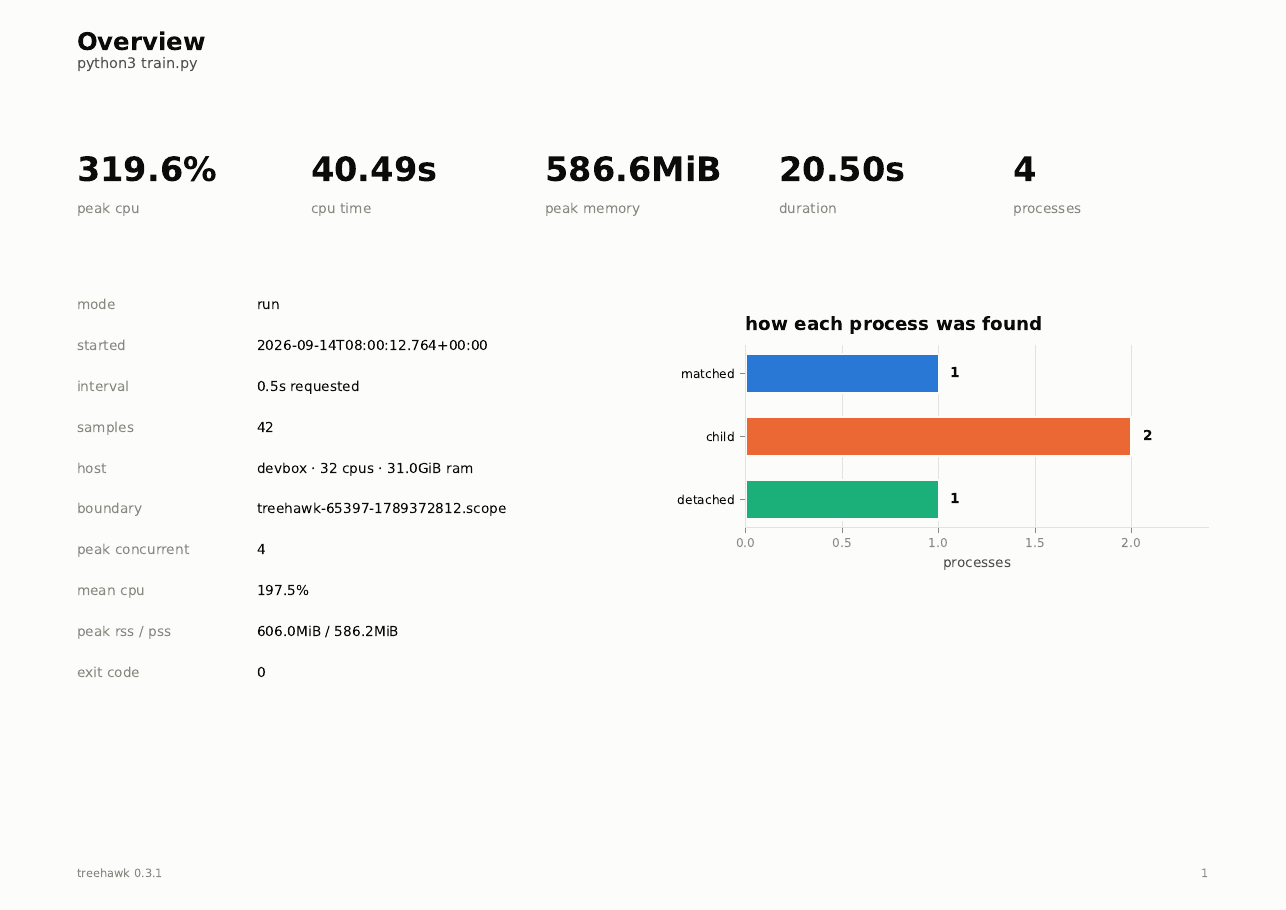
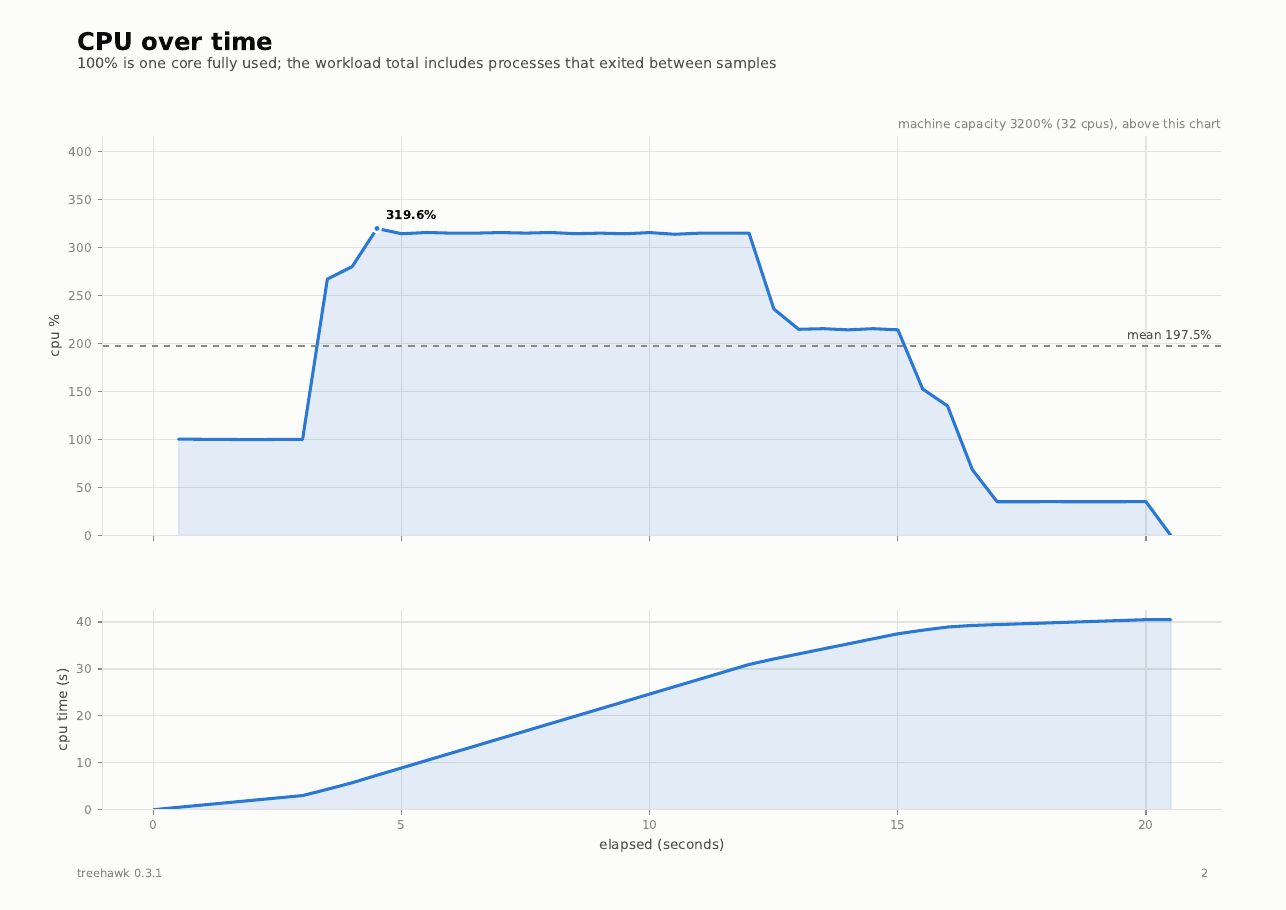
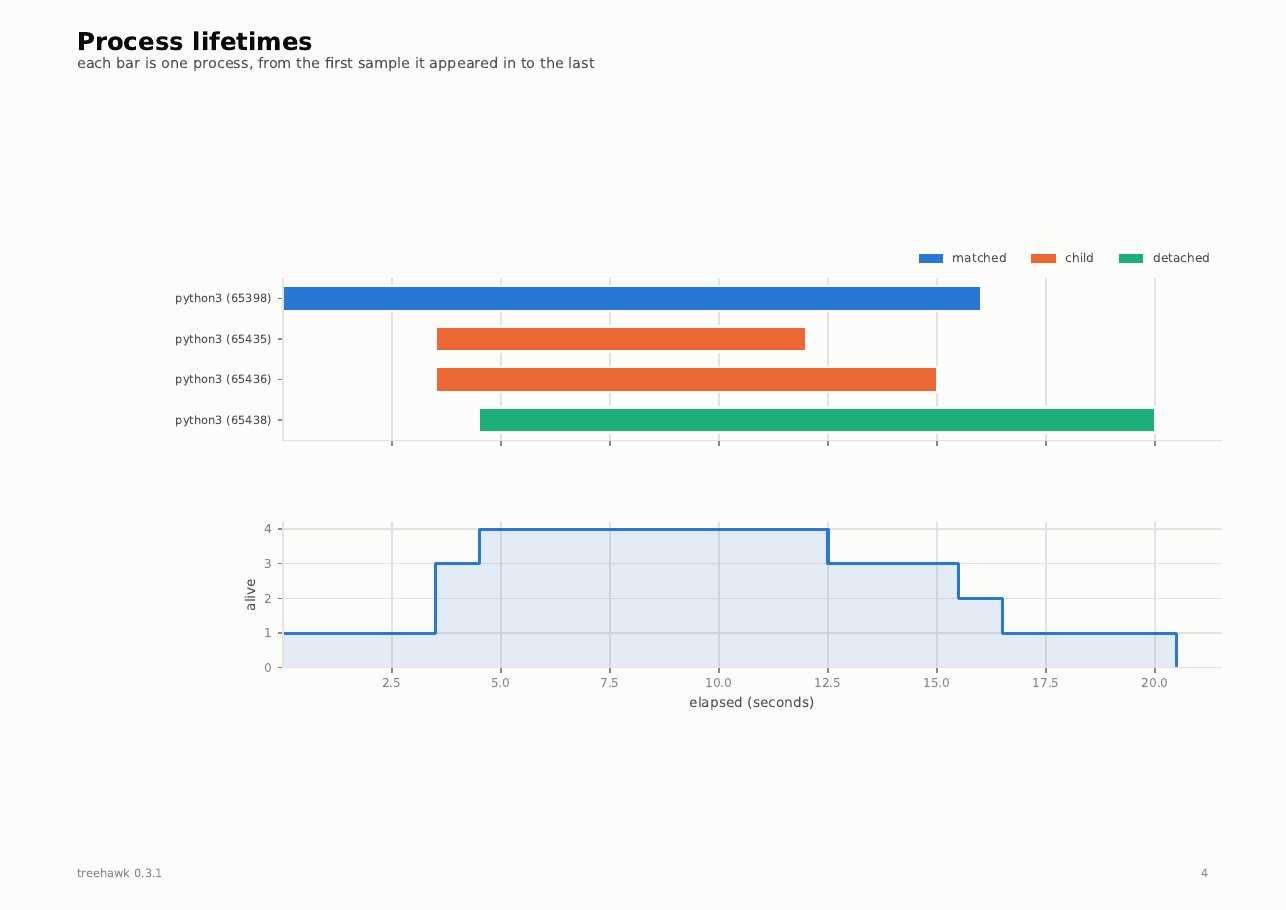
A workload log becomes eight pages, each answering one question. Download a sample report.
| Page | Question |
|---|---|
| Overview | What happened, in five numbers, and how each process was found |
| CPU over time | Was it busy, and did it stay busy? |
| Memory over time | How much, by each of the three measures |
| Process lifetimes | Who was alive, when: one bar per process |
| CPU by process | Which process was burning the CPU |
| Memory by process | Which process was holding the memory |
| Biggest consumers | The two league tables |
| Sampling quality | Can you trust the other seven pages? |
Pages that need per-process detail are left out of an --aggregate-only log
rather than printed blank.
A top log becomes five pages: machine overview; the whole machine's CPU and
memory, with spikes marked; CPU by process; memory by process; and spikes and
leak suspects. The charts keep the peak of each time bucket, so a spike still
shows in a month of data.
The workload log
watch and run write JSON Lines by default: a header record, one sample
per interval, and a summary at the end. Each line is flushed as it is written,
so a killed run still leaves a readable log.
{"type":"header","mode":"run","argv":["python3","train.py"],"interval":0.5,
 "memory_kind":"pss","host":{"ncpu":32},"notes":[]}
{"type":"sample","seq":12,"t":6.0,"n_procs":4,
 "cpu_percent":315.5, "cpu_percent_norm":9.9, "cpu_seconds_total":18.4,
 "rss_bytes":642269184, "pss_bytes":614628352, "group_memory_bytes":615354368,
 "overrun":false,
 "procs":[{"pid":65438,"ppid":1,"name":"python3","cpu_percent":34.0,"rss_bytes":68263936,"via":"cgroup"}]}
{"type":"summary","samples":42,"duration_s":20.5,"peak_cpu_percent":319.64,"exit_code":0,
 "top_by_cpu":[...],"top_by_memory":[...]}
The fields you will reach for most:
| Field | |
|---|---|
memory_kind |
header: which fair measure pss_bytes carries, pss (Linux) or phys_footprint (macOS); a log without it is pss |
notes |
header: anything treehawk could not measure on this machine, and why |
cpu_percent |
CPU over the last interval, summed across processes; 100 is one core, null in the first sample |
cpu_percent_norm |
the same, as a share of the whole machine |
cpu_seconds_total |
lifetime CPU time, including exited children |
cpu_seconds_used |
CPU time since treehawk attached |
rss_bytes, pss_bytes, swap_bytes |
memory; see which one to trust |
group_memory_bytes, group_memory_peak_bytes |
the kernel's own charge for the boundary; null without one, and always on macOS |
overrun |
this sample arrived more than 1.5 intervals late |
procs[].via |
which membership rule found the process |
null always means the value could not be read; treehawk never writes a guess.
--aggregate-only drops procs.
A few jq recipes:
tail -n 1 run.jsonl | jq .                                               # the summary
jq -s 'map(select(.type == "sample")) | max_by(.cpu_percent) | {t, cpu_percent}' run.jsonl
jq -r 'select(.type == "sample") | [.t, .cpu_percent, .pss_bytes] | @csv' run.jsonl
CSV
--csv writes four files instead of one:
| File | |
|---|---|
run.csv |
one row per sample |
run.procs.csv |
one row per process per sample, joined to run.csv on seq; not written with --aggregate-only |
run.header.json |
the header |
run.summary.json |
the summary |
What the workload printed
run keeps the command's stdout and stderr, together and in order, in
<log>.out, so run.jsonl is accompanied by run.out. It is the raw stream,
escape codes included:
less -R run.out                # with the colours
grep -n "Traceback" run.out    # what went wrong, next to what it cost
Only run writes it, and only when it captured the output (see What the
command prints). watch never does,
because the process was already running and its output was never treehawk's to
read.
The top log
top writes a directory of segments, one directory per boot:
treehawk-top/<boot>/top-20260927-140000.jsonl      the segment being written
treehawk-top/<boot>/top-20260927-130000.jsonl.gz   a closed one, compressed
Each segment is complete on its own: it opens with a header, ends with a
summary, and in between holds:
| Record | |
|---|---|
proc |
who a process is (pid, starttime, name, cmdline), written the first time a segment mentions it |
sample |
the machine line (host: cpu_percent, mem_used_bytes, mem_available_bytes, swap_used_bytes) plus a compact row per top-N process in top |
event |
enter or leave the top N, spike, or creep, with the value, baseline or slope_per_hour that triggered it |
Each row in top is a list in the order the header's row_fields names:
pid, starttime, cpu_percent, rss_bytes, pss_bytes, swap_bytes,
gpu_memory_bytes, reasons. reasons says why the process is there: c for
CPU, m for memory, or cm for both. Because a command line is written once
per segment and not in every row, a log can run for the lifetime of a machine.